
Why in News?
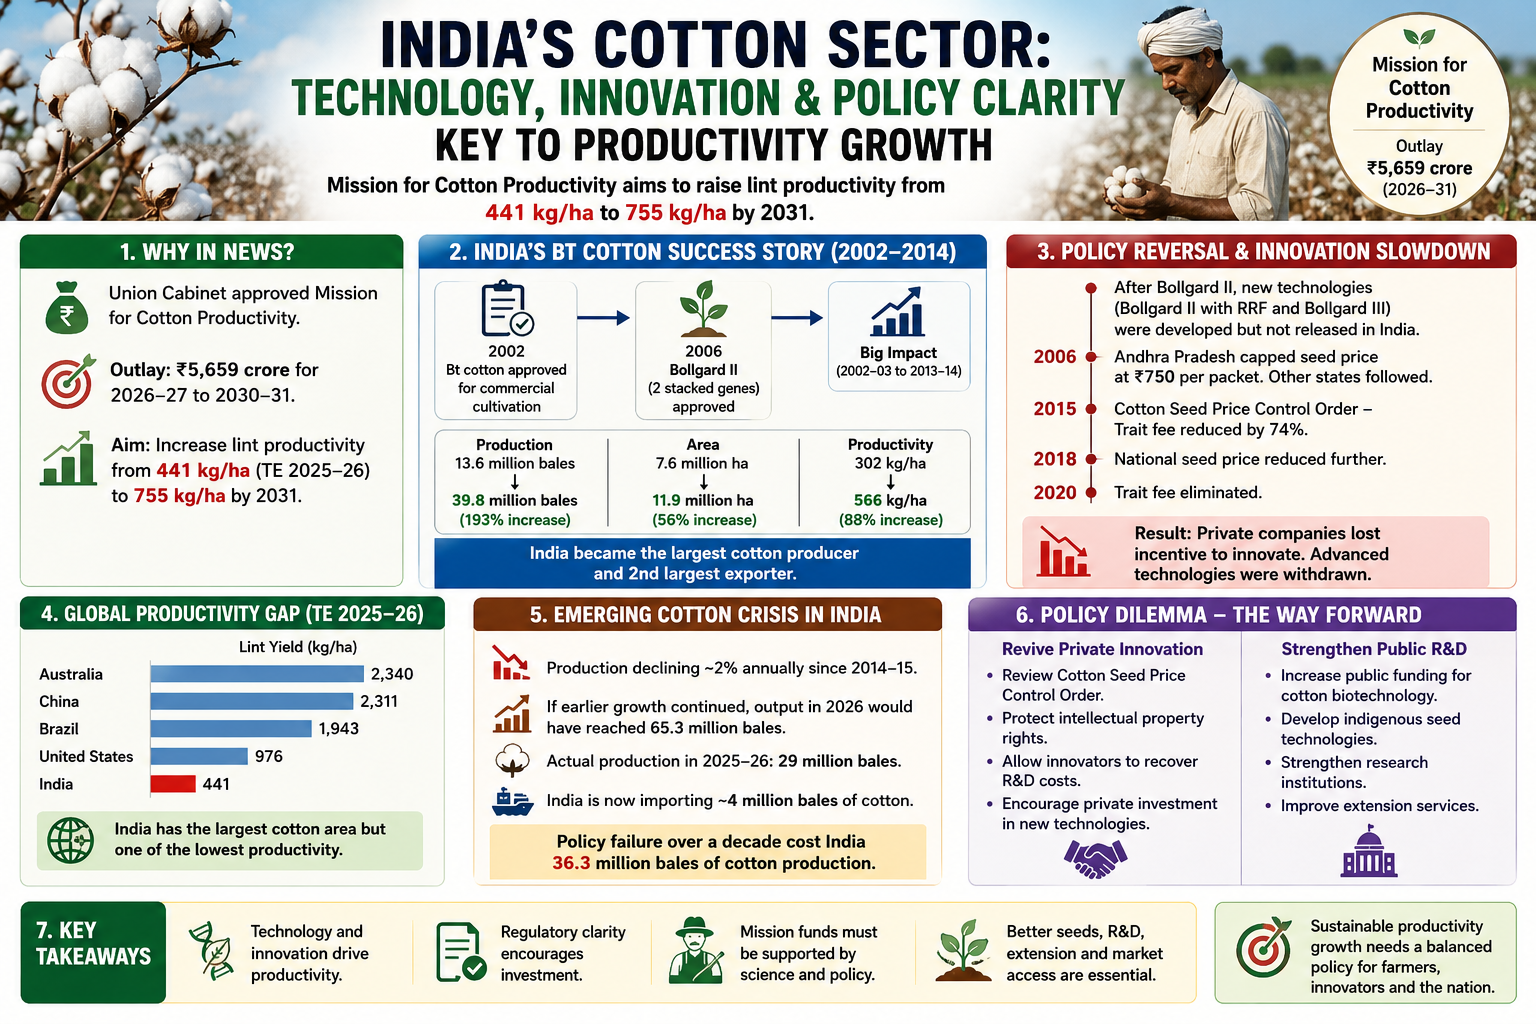
The Union Cabinet approved the Mission for Cotton Productivity with an outlay of ₹5,659 crore for the period 2026–27 to 2030–31.
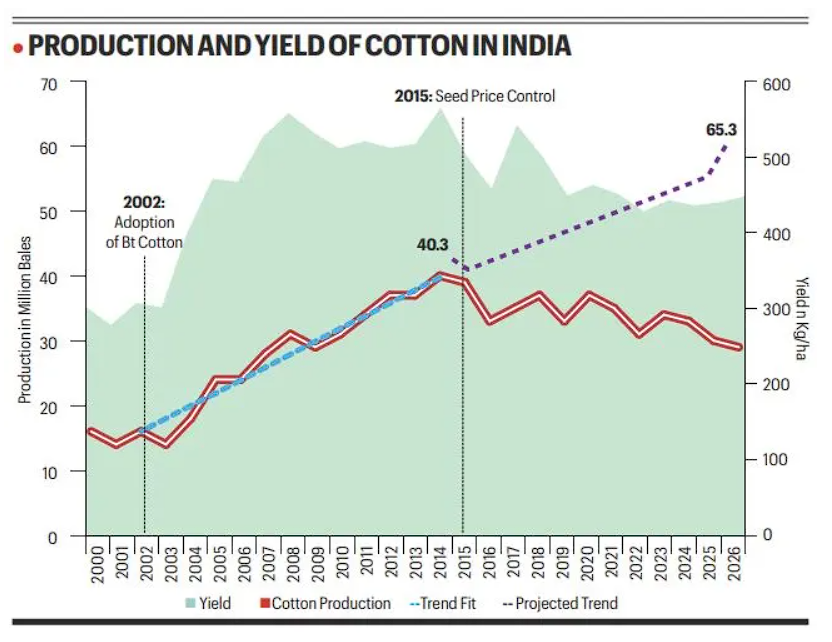
The mission aims to raise India’s cotton lint productivity from 441 kg per hectare in the triennium ending 2025–26 to 755 kg per hectare by 2031. The mission is important because India’s cotton sector is facing declining productivity, technological stagnation and growing import dependence.
What is the Mission for Cotton Productivity?
- The mission is a Central initiative to improve cotton productivity in India.
- It will run from 2026–27 to 2030–31.
- Its approved outlay is ₹5,659 crore.
- It aims to increase lint productivity from 441 kg/ha to 755 kg/ha by 2031.
- It seeks to address productivity stagnation in cotton cultivation.
- It is linked to India’s textile economy, farmer income and agricultural competitiveness.

India’s Bt Cotton Success Story
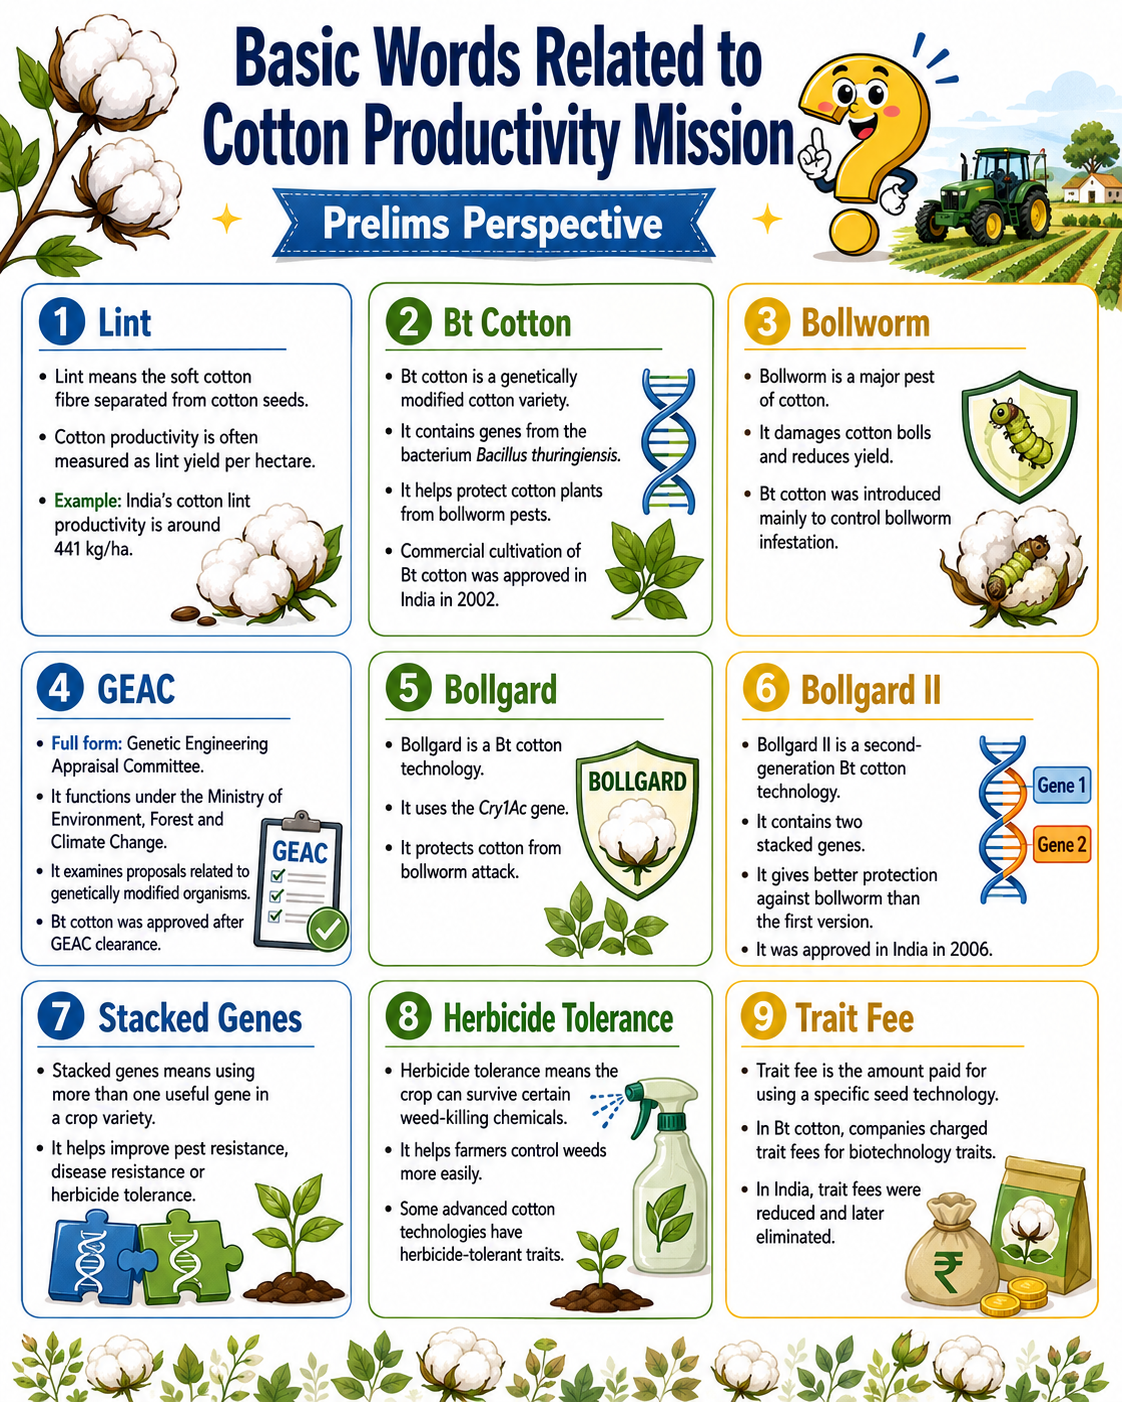
- A major shift came in 2002, when India approved the commercial cultivation of Bt cotton.
- The approval was given after clearance by the Genetic Engineering Appraisal Committee.
- The first Bt cotton hybrids used the Cry1Ac gene to control bollworm infestation.
- In 2006, Bollgard II was approved with two stacked genes for better pest resistance.
- Impact between 2002–03 and 2013–14:
| Indicator | 2002–03 | 2013–14 | Change |
| Cotton production | 13.6 million bales | 39.8 million bales | 193% increase |
| Cotton area | 7.6 million ha | 11.9 million ha | 56% increase |
| Productivity | 302 kg/ha | 566 kg/ha | 88% increase |
- India became the largest cotton producer and the second-largest exporter of cotton.
- This period showed how biotechnology can transform agricultural productivity and farmer incomes.
Policy Reversal and Innovation Slowdown
- After Bollgard II, newer technologies such as Bollgard II with Roundup Ready Flex and Bollgard III were developed.
- These technologies included:
- Three stacked genes
- Herbicide-tolerant traits
- Better pest management
- Improved weed control
- However, these advanced technologies were not commercialised in India.
Role of Price Controls
| Year | Policy Step | Impact |
| 2006 | Andhra Pradesh capped seed price at ₹750 per packet | Reduced seed company returns |
| 2015 | Cotton Seed Price Control Order | Trait fee reduced by 74% |
| 2018 | National seed price reduced further | Lowered commercial incentive |
| 2020 | Trait fee eliminated | Reduced incentive for private innovation |
- Due to price controls and weak intellectual property protection, private biotechnology firms reduced interest in bringing advanced cotton technologies to India.
- This slowed down seed innovation and technological renewal in cotton farming.
Global Cotton Productivity Gap
India has the world’s largest cotton-growing area, but its productivity is far below global competitors.
Cotton Lint Yield: TE 2025–26
| Country | Cotton Productivity |
| Australia | 2,340 kg/ha |
| China | 2,311 kg/ha |
| Brazil | 1,943 kg/ha |
| United States | 976 kg/ha |
| India | 441 kg/ha |
- The productivity gap reflects differences in:
- Biotechnology adoption
- Seed innovation
- R&D investment
- Regulatory support
- Agronomic practices
- Brazil has achieved high productivity even though a large share of its cotton is rainfed.
Emerging Cotton Crisis in India
- India’s cotton production has been declining at an average annual rate of around 2% since 2014–15.
- If India had continued on the earlier growth path between 2002 and 2014, cotton output in 2026 could have reached 65.3 million bales.
- Actual cotton production in 2025–26 is around 29 million bales.
- The gap of 36.3 million bales shows the cost of productivity stagnation.
- India has moved from being a net exporter to importing around 4 million bales of cotton.
- This raises concerns for:
- Farmer income
- Textile industry competitiveness
- Cotton self-sufficiency
- Export potential
Key Concerns with the Mission
- The target of 755 kg/ha by 2031 is ambitious.
- India currently lacks access to next-generation cotton biotechnology used by global competitors.
- Advanced GM cotton varieties remain unavailable to Indian farmers.
- Private-sector innovation has weakened due to price controls.
- Public-sector R&D remains underfunded.
- Regulatory approval for biotechnology remains long and uncertain.
- Even if India achieves 755 kg/ha, it will remain far below Brazil, China and Australia.
Policy Dilemma
India faces two major choices.
1. Revive Private Innovation
- Reconsider the Cotton Seed Price Control Order.
- Strengthen intellectual property protection.
- Allow innovators to recover R&D investment.
- Encourage private seed companies to bring advanced technologies.
2. Expand Public Sector R&D
- Increase public funding for cotton biotechnology.
- Develop indigenous seed technologies.
- Strengthen agricultural universities and research institutions.
- Improve extension services for farmers.
- Promote locally suitable, climate-resilient cotton varieties.
Significance
- Cotton is a major fibre crop and supports millions of farmers.
- It is closely linked with India’s textile and garment industry.
- Higher productivity can reduce import dependence.
- Improved cotton output can support farmer incomes.
- Technology-led cotton growth can improve rural employment.
- Cotton productivity is important for India’s export competitiveness.
- The mission can help revive India’s position in global cotton markets.
Challenges
- Low cotton productivity compared to global competitors.
- Slow adoption of advanced biotechnology.
- Price controls reducing incentives for seed innovation.
- Weak public agricultural R&D funding.
- Pest resistance and weed management problems.
- Rainfed nature of much of India’s cotton cultivation.
- Fragmented landholdings and uneven extension services.
- Regulatory uncertainty around GM crops.
- Risk of increased import dependence.
Way Forward
- Create a balanced seed policy that protects farmers and encourages innovation.
- Review trait fee and seed price regulation without hurting affordability.
- Strengthen the GEAC approval process with scientific transparency.
- Promote next-generation cotton technologies after proper biosafety evaluation.
- Increase public investment in cotton biotechnology and plant breeding.
- Improve extension services for pest management, irrigation and soil health.
- Promote climate-resilient and region-specific cotton varieties.
- Encourage public-private partnerships in seed research.
- Link the mission with textile value chain needs.
- Ensure farmer access to affordable and advanced seed technologies.
Conclusion
The Mission for Cotton Productivity recognises the seriousness of India’s cotton crisis. Its target of raising productivity is welcome, but productivity cannot rise sustainably without technological renewal.
India’s cotton success between 2002 and 2014 showed the power of biotechnology. However, policy uncertainty, price controls and weak R&D have slowed innovation. The long-term revival of cotton requires a balanced framework that protects farmers, supports scientific innovation, strengthens public research and provides access to advanced seed technologies.
Without addressing these structural issues, the mission may improve outcomes only partially and fail to restore India’s global cotton competitiveness.
Why in News?
India has highlighted infrastructure as a key driver of economic growth, service delivery and regional connectivity. Over the past decade, large-scale investments in railways, roads, airports, ports, housing, water, energy, logistics and digital networks have strengthened India’s transition towards a modern and integrated economy.
Initiatives such as PM Gati Shakti, National Logistics Policy, Sagarmala, Bharatmala, UDAN, Jal Jeevan Mission and PM-WANI have supported better mobility, wider digital access, improved logistics efficiency and inclusive development.
Infrastructure as an Instrument of Nation Building
- Infrastructure is not only about physical assets. It directly shapes people’s daily lives by improving access to roads, railways, airports, housing, water, electricity, digital services and markets.
- After 2014, India’s infrastructure policy shifted from fragmented project execution to integrated planning and long-term capacity creation.
- Public capital expenditure increased from about ₹2 lakh crore in FY2014–15 to ₹12.2 lakh crore in FY2026–27. This shows a strong focus on infrastructure-led growth.
- Major programmes such as Sagarmala, Bharatmala, PM Gati Shakti, PMAY, Jal Jeevan Mission, PM Ujjwala Yojana and UDAN have linked infrastructure with household welfare, economic opportunity and regional development.
Railways under Transformation
Indian Railways has undergone large-scale modernisation since 2014.
Major Developments
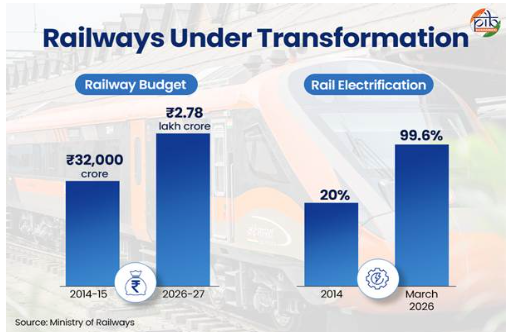
- Budgetary support increased from around ₹32,000 crore in 2014–15 to ₹2.78 lakh crore in FY2026–27.
- Rail electrification increased from about 20% before 2014 to 99.6% by March 2026.
- A total of 69,873 route kilometres have been electrified.
- As of April 2026, 162 Vande Bharat train services are operational.
- 60 Amrit Bharat Express services are operational, supporting affordable long-distance travel.
- Vande Bharat Sleeper, launched in January 2026, carried 1.21 lakh passengers in its first three months.
High-Speed Rail
- The Mumbai–Ahmedabad High-Speed Rail Corridor is under construction.
- The corridor is 508 km long and designed for speeds up to 320 kmph.
- The Union Budget 2026–27 announced plans for seven new high-speed rail corridors.
Railway Safety
- Kavach, India’s indigenous automatic train protection system, has been deployed across 3,103 route km.
- Implementation is underway on 24,427 km across major corridors.
- Train accidents declined from 135 in 2014–15 to 16 in 2025–26.
Landmark Railway Projects
| Project | Importance |
| Chenab Bridge, 2025 | World’s highest railway arch bridge; 359 metres above Chenab River |
| Anji Khad Bridge, 2025 | India’s first cable-stayed railway bridge |
| Pamban Bridge, 2025 | India’s first vertical-lift railway sea bridge |
| Bairabi–Sairang Line, 2025 | Strengthens rail connectivity to Mizoram through difficult terrain |
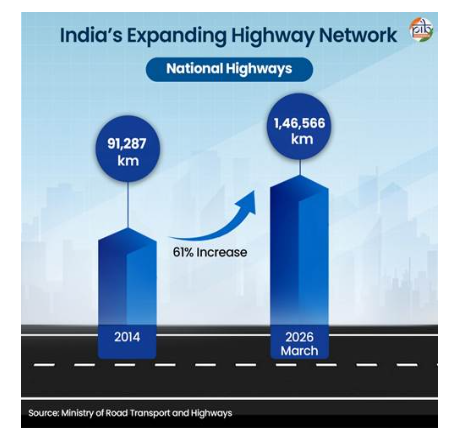
Roads and Highways
India has the second-largest road network in the world, with 63.73 lakh km.
Key Developments
- National Highways increased from 91,287 km in FY14 to 1,46,566 km in March 2026.
- Four-lane and above National Highways increased from 18,371 km in 2014 to 45,516 km.
- 3,644 km of access-controlled high-speed corridors and expressways have been operationalised.
Pradhan Mantri Gram Sadak Yojana
PMGSY has transformed rural connectivity through all-weather roads.
- Budgetary allocation increased from ₹386 crore in 2014–15 to ₹19,000 crore in 2026–27.
- 99.6% of eligible habitations have been connected.
- Completed roads increased from 3.86 lakh km during 2000–2014 to 4.11 lakh km during 2014–2026.
- Completed bridges increased from 484 to 10,293.
Bharatmala Pariyojana
Bharatmala Pariyojana, approved in 2017, focuses on economic corridors, border roads, coastal roads and expressways.
- Under Bharatmala, 22,590 km of roads have been completed till 31 March 2026.
Landmark Road Projects
| Project | Importance |
| Atal Tunnel, 2020 | World’s longest highway tunnel above 10,000 feet |
| Dhola-Sadiya Bridge, 2017 | First permanent road link between Assam and Arunachal Pradesh |
| Maitri Setu, 2021 | Connects Tripura with Bangladesh |
| Sudarshan Setu, 2024 | Connects Okha with Beyt Dwarka |
| Z-Morh/Sonamarg Tunnel, 2025 | Provides all-weather access in Jammu and Kashmir |
Civil Aviation and Regional Air Access
Civil aviation has expanded regional connectivity after 2014.
- Operational airports increased from 74 in 2014 to 165 in 2026.
- Investments exceeded ₹1.4 lakh crore.
UDAN Scheme
The UDAN scheme, launched in 2016, improved affordable air travel.
- As of 2026, 665 routes connect 95 airports, heliports and water aerodromes.
- More than 1.64 crore passengers benefited.
- The Modified UDAN scheme, launched in 2026, has an outlay of ₹28,840 crore and aims to connect 120 new destinations.
Digital Aviation
- Digi Yatra is operational at 38 airports.
- It has benefited over 9.3 crore passengers.
- GAGAN, operationalised in 2015, is the world’s first equatorial Satellite-Based Augmentation System.
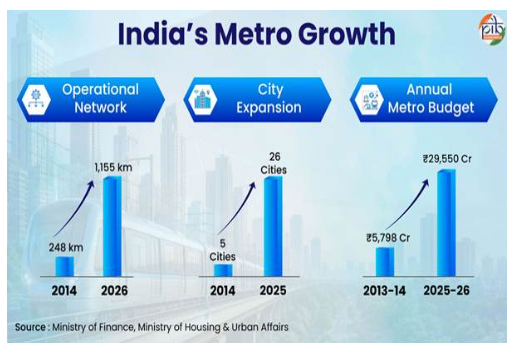
Metro and Urban Transit Systems
India’s metro network has expanded rapidly.
- Metro network length increased from 248 km in 2014 to more than 1,155 km in 2026.
- India now has the world’s third-largest metro network.
- Cities with metro connectivity increased from 5 in 2014 to 26 in 2025.
- Daily metro ridership increased from around 28 lakh to more than 1.15 crore passengers.
Major Urban Transit Innovations
- Kolkata launched India’s first underwater metro tunnel beneath the Hooghly River in 2024.
- Kochi Water Metro connected islands around Kochi using electric hybrid boats.
- Namo Bharat Rapid Rail, 2025 on the Delhi–Meerut corridor introduced advanced signalling technology.
Ports, Shipping and Maritime Connectivity
Maritime transport handles about 95% of India’s trade by volume and 70% by value.
Sagarmala Programme
Sagarmala, launched in 2015, supports port-led development.
- As of March 2026, 78 projects worth ₹5,356.75 crore were completed.
Inland Waterways
- National Waterways increased from 5 in 2014 to 111 in 2026.
- They span 20,187 km across 23 States and 4 Union Territories.
- Cargo movement rose from 29 MMT to 218 MMT.
- Ferry and Ro-Pax passenger movement reached 10.55 crore.
Industrial and Manufacturing Infrastructure
Industrial infrastructure supports investment, employment and manufacturing growth.
- As of May 2026, 4,220 industrial parks are mapped on the India Industrial Land Bank.
- These cover around 6.98 lakh hectares.
- Around 272 plug-and-play industrial parks are operational.
- 20 industrial smart cities and industrial areas are being developed under the National Industrial Corridor Development Programme.
BHAVYA Scheme
The BHAVYA scheme, approved in March 2026, aims to develop 100 new plug-and-play industrial parks across India.
The Union Budget 2026–27 also proposed:
- Three chemical parks
- Seven PM MITRA parks
- MSME clusters
- ₹10,000 crore Biopharma SHAKTI programme
Logistics and National Competitiveness
India has shifted towards multimodal and technology-driven logistics planning.
PM Gati Shakti
- Launched in October 2021.
- It is a GIS-based integrated infrastructure planning platform.
- It brings together 58 Ministries and Departments.
- It uses more than 3,202 data layers as of June 2026.
National Logistics Policy
- Launched in September 2022.
- India’s rank in the World Bank Logistics Performance Index improved from 54 in 2014 to 38 in 2023.
- India aims to enter the top 25 by 2030.
Digital Logistics Platforms
| Platform | Purpose |
| ULIP, 2022 | Integrates logistics data from multiple ministries |
| Logistics Data Bank, 2016 | Tracks EXIM container movement |
| NETC FASTag, 2016 | Enables electronic toll collection |
PRAGATI
- Launched in 2015.
- 382 projects worth over ₹85 lakh crore have been reviewed.
- 2,958 issues have been resolved.
Water Infrastructure and Water Security
The creation of the Ministry of Jal Shakti in 2019 brought drinking water, sanitation and water resources under a unified framework.
Jal Jeevan Mission
- Launched in 2019.
- At launch, only 3.23 crore rural households had tap water connections.
- As of June 2026, around 15.86 crore households received tap water connections.
- Coverage reached 81.94%.
- The mission has been extended till 2028.
Other Water Programmes
- PMKSY, 2015: Improves irrigation and water-use efficiency.
- Namami Gange, 2014: Supports river rejuvenation and pollution control.
- Ken–Betwa Link Project, 2021: India’s first river interlinking project under implementation.
- Dam Safety Act, 2021: Strengthens dam safety and monitoring.
Housing and Household Infrastructure
Housing development has focused on affordability, dignity and access to basic services.
PMAY-Urban
- Launched in 2015.
- PMAY-U 2.0, launched in September 2024, aims to support one crore additional urban beneficiaries by 2028–29.
- Out of 125.31 lakh sanctioned houses, around 98.10 lakh houses were completed by May 2026.
- Around 96% of houses under PMAY-U 2.0 were allotted to women.
PMAY-Gramin
- Launched in 2016.
- Aims to provide 4.95 crore houses to eligible rural households by March 2029.
- As of June 2026, 3.91 crore houses were sanctioned and 3.06 crore houses completed.
- Around 75% of beneficiaries are women.
SWAMIH Fund
- Launched in 2019.
- Supports stalled affordable and mid-income housing projects.
- It has delivered more than 63,000 homes.
Energy Security and Universal Electrification
India’s energy policy has focused on electricity access, renewable energy, clean cooking, transmission infrastructure and efficiency.
Power Sector
- Power shortage declined from 4.2% in 2014 to 0.03% in 2025–26.
- Average rural electricity availability increased from 12.5 hours to 22.6 hours per day.
- Installed power capacity reached 532.74 GW by March 2026, compared to 248 GW in 2014.
Renewable Energy
India became:
- 3rd largest clean energy capacity holder globally.
- 4th largest in installed wind energy capacity globally.
Major Schemes
- Saubhagya, 2017: Electrified nearly 2.86 crore households.
- PM Surya Ghar: Muft Bijli Yojana, 2024: Aims to provide rooftop solar systems to one crore households.
- GOBARdhan, 2018: Converts biodegradable waste into biogas and organic manure.
- International Solar Alliance: Includes 125 member countries.
- Global Biofuels Alliance: Expanded to 33 countries and 14 international organisations as of 1 June 2026.
Clean Cooking Access and LPG Infrastructure
Clean cooking access improved through LPG infrastructure and the Pradhan Mantri Ujjwala Yojana.
- LPG coverage increased from 55.9% in 2014 to 107.2% in 2026.
- LPG consumers increased from 14.51 crore to 33.39 crore.
- LPG consumption increased from 17.6 MMT in FY2014–15 to 34 MMT in FY2025–26.
- PMUY refill delivery reached around 49.21 crore cylinders during FY2025–26.
Digital Connectivity and Public Digital Infrastructure
Digital infrastructure has become central to governance, payments, education, healthcare and citizen services.
Telecom and Internet Growth
- Tele-density increased from 75.23% in 2014 to 86.23% in 2025.
- Internet connections increased from 25.15 crore to 100.29 crore.
- Broadband connections increased from 6.1 crore to 99.56 crore.
- Average monthly data consumption increased from 61.66 MB to 24.01 GB per user.
- Around 85.5% households own at least one smartphone.
PM-WANI and 5G
- PM-WANI, launched in 2020, expanded public Wi-Fi hotspots.
- As of June 2026, more than 4.10 lakh Wi-Fi hotspots are operational.
- 5G services are available in 99.9% of districts with about 85% population coverage.
Digital Public Infrastructure
- Aadhaar generation increased from 63.22 crore in 2014 to more than 144 crore by March 2026.
- Jan Dhan accounts increased from 14.72 crore in 2015 to 57.71 crore in 2026.
- In March 2026, UPI processed around 2,264 crore transactions worth over ₹29.53 lakh crore.
- UPI is operational across eight countries.
Citizen-Centric Digital Platforms
| Platform | Role |
| DigiLocker | Secure access to digital documents |
| UMANG | Single platform for government services |
| CSCs | Rural and urban digital service delivery |
| eHospital | Digital healthcare services |
| DIKSHA | Digital education platform |
| SWAYAM | Online learning and DTH education channels |
Significance of Infrastructure Development
- Economic growth: Better infrastructure reduces logistics cost and improves productivity.
- Regional integration: Roads, railways, airports and waterways connect remote regions.
- Inclusive development: Housing, water, electricity and digital access improve quality of life.
- Employment generation: Infrastructure projects create direct and indirect jobs.
- Green transition: Electrification, renewable energy and clean transport reduce emissions.
- Industrial growth: Industrial parks, corridors and logistics systems attract investment.
- Digital governance: Public digital infrastructure improves transparency and service delivery.
- Strategic mobility: Border roads, tunnels and bridges support defence preparedness.
- Ease of living: Better transport, housing, water and digital services improve citizen convenience.
Challenges
- Land acquisition delays.
- Environmental concerns in fragile areas.
- Cost overruns and time delays.
- Coordination issues among ministries and States.
- Maintenance of large infrastructure assets.
- Financing challenges for long-term projects.
- Regional imbalance in infrastructure access.
- Digital divide and affordability issues.
- Urban congestion despite metro expansion.
- Need for skilled manpower and advanced technology.
Way Forward
- Strengthen integrated planning through PM Gati Shakti.
- Improve real-time project monitoring using digital platforms.
- Promote multimodal logistics and reduce logistics cost.
- Ensure sustainable infrastructure in ecologically sensitive regions.
- Expand green transport, renewable energy and clean fuel systems.
- Improve last-mile connectivity in rural, tribal and border areas.
- Strengthen public-private partnerships where suitable.
- Focus on asset maintenance and life-cycle management.
- Link infrastructure with employment, manufacturing and exports.
- Ensure inclusive access to digital, housing, water and energy infrastructure.
Conclusion
Infrastructure is the foundation of India’s journey towards Viksit Bharat 2047. Expansion of railways, roads, airports, ports, housing, water, energy and digital networks has improved connectivity, welfare delivery and economic competitiveness.
The next phase must focus on sustainability, safety, affordability, regional balance and last-mile access. A well-planned infrastructure ecosystem can strengthen national integration, inclusive development and India’s position as a modern global economy.