TGPSC Current Affairs 20 August 2026 featuring Telangana SIR 2026 and agriculture updates

Relevance: TGPSC Group I: Electoral administration and governance in Telangana

Important Keywords for Prelims and Mains

For Prelims:

  • SIR, draft electoral roll, Enumeration Form, ERO, BLO, ASDD, Form 6

For Mains:

  • Electoral inclusion, documentary verification, administrative capacity, claims and objections, voter exclusion

Why in News?

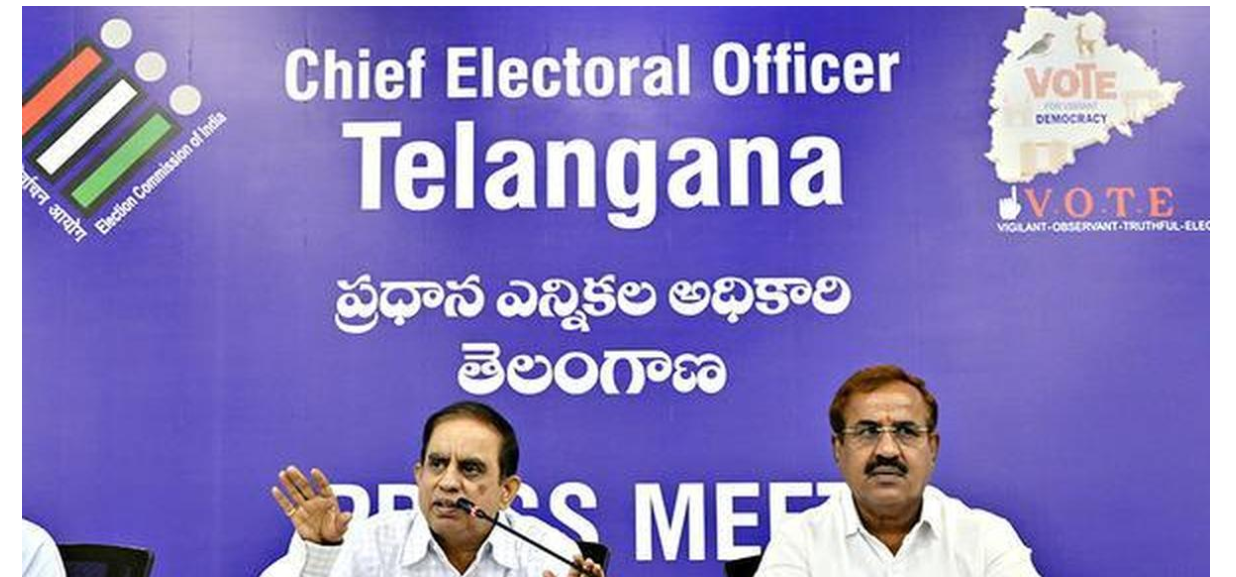
The draft electoral roll prepared under the Special Intensive Revision 2026 in Telangana was published on August 17. Around 92.87 lakh electors included in the draft roll are set to receive notices because of logical discrepancies or failure to establish a link with the 2002 SIR roll.
Progress of Telangana SIR

The revision began on June 15, 2026. After ten days of preparation, training and printing of Enumeration Forms, the enumeration phase commenced on June 25.

The initial deadline of July 24 was extended twice:

  • First to August 3
  • Subsequently to August 10

The exercise involved:

  • 33 District Election Officers
  • 119 Electoral Registration Officers
  • 892 Assistant Electoral Registration Officers
  • 35,985 Booth-Level Officers
  • 3,590 BLO supervisors

Enumeration Forms were distributed for 3,38,26,448 electors included in the 2025 rolls.

Key Electoral-Roll Figures

CategoryNumberShare
Electors in the 2025 roll3,38,26,448100%
Electors included in draft roll2,64,87,21378.3%
Names deleted73,39,23521.7%
Electors due for notices92,87,57735% of draft roll
Notices for anomalies60,50,918
Notices for non-mapping with 2002 SIR32,36,659
  • Deletion categories include absent, shifted, deceased and duplicate electors, collectively referred to as ASDD, besides other cases.
  • A notice does not itself amount to deletion. It initiates further verification by the electoral authorities.

Why Will Electors Receive Notices?

Notices will be issued for two principal reasons:

Logical Discrepancies

Around 60.50 lakh electors have inconsistencies involving age, family relationships, names, relative type or documents.

Non-Mapping with the 2002 SIR

Approximately 32.36 lakh electors could not be linked with an elector or relative appearing in the 2002 SIR roll.

Of the unmapped voters, 23,05,799, or 71%, belong to 24 Assembly constituencies across four districts in the capital region.

Eleven Identified Anomalies

The Chief Electoral Officer listed the following discrepancies:

  1. Gap of less than nine months between children
  2. Gap of less than 15 years between parent and child
  3. Age gap exceeding 50 years between child and parent
  4. Gap of less than 40 years between elector and grandparent
  5. Parent’s name differing from the previous SIR
  6. Different relative type in the current and previous rolls
  7. Father recorded in the current roll but husband in the previous roll
  8. Different father’s name in the two rolls
  9. Incorrect age difference between the current and previous SIR
  10. Submission of zero documents
  11. Submission of Aadhaar alone

Name mismatch between the current draft and the 2002 roll is also being treated as a significant discrepancy, although it is not included in the formal list. Even initials appearing in one roll and a full name in another may result in a notice.

Problems in Mapping with the 2002 SIR

Names in the 2002 roll were sometimes shortened or misspelt. Later revisions and the use of full names in Aadhaar resulted in variations between older and current records.

Other difficulties included:

  • Errors in names and ages
  • Changes in the description of relatives
  • Electors entering current EPIC details in sections meant for 2002 information
  • Limited field assistance from BLOs in some urban areas

Rural BLOs were reported to have been more active in helping voters understand the mapping process than their urban counterparts.

ASDD Categories

Absent

An elector was not found at the recorded address during verification.

Shifted

The elector was considered to have moved from the registered location.

Deceased

A total of 9,22,229 deaths were recorded. These entries are considered relatively reliable because death certificates were uploaded as evidence.

Duplicate

  • Duplicate entries were identified through software. However, automated matching may produce errors and therefore requires verification.
  • Concerns have arisen over absent and shifted classifications because house-to-house visits were reportedly not conducted consistently in some urban areas. Certain BLOs operated from central locations for the distribution and collection of forms instead of visiting individual households.
  • Electors mistakenly placed in ASDD categories have been advised to approach the authorities for correction.

Notice and Verification Process

The notice phase began on August 17, following the conclusion of enumeration.

Procedure

  1. Notices will be delivered through BLOs.
  2. Electors must submit their replies through the BLO.
  3. The ERO or Assistant ERO may contact the elector by telephone if clarification is required.
  4. The elector may also be summoned for a hearing.
  5. Verification will continue until October 15.

This stage gives electors an opportunity to explain discrepancies and establish their eligibility before the final roll is prepared.

Claims and Objections

The claims and objections period extends from August 17 to September 16.

During this period, electors can:

  • Challenge an incorrect ASDD classification
  • Seek restoration of an omitted name
  • Submit supporting documents
  • Correct errors in personal or family details

Electors whose names were removed during an earlier summary revision and who did not receive Enumeration Forms must apply as new voters using Form 6, even if they had voted in earlier elections.

Activists have demanded that ASDD lists be displayed prominently on the websites of the Telangana Chief Electoral Officer and the ECI.

Documentary Requirements

Indicative Designated Documents

  1. Identity card or Pension Payment Order issued to a regular government or PSU employee or pensioner
  2. Government, local authority, bank, Post Office, LIC or PSU document issued before July 1, 1987
  3. Birth certificate
  4. Passport
  5. Recognised matriculation or educational certificate
  6. Permanent Residence Certificate
  7. Forest Rights Certificate
  8. OBC, SC, ST or other caste certificate
  9. National Register of Citizens, wherever applicable
  10. Family Register maintained by government officials under a statutory or administrative regulation
  11. Land or house allotment certificate

Aadhaar alone has been included among cases inviting further verification.

Documents Required by Birth Category

Birth CategoryRequirement
Born in India before July 1, 1987Proof of the elector’s date and/or place of birth
Born between July 1, 1987 and December 2, 2004Proof relating to the elector and one parent
Born after December 2, 2004Proof relating to the elector, father and mother
Born outside IndiaProof such as a birth-registration certificate issued by an Indian Mission abroad

Family Registration Certificate Issue

  • The Telangana government ordered the issue of Family Registration Certificates on July 25 after concerns that genuine electors might lack designated documents.
  • The ECI rejected the certificate because applicant data was digitally extracted from ration or Food Security Cards rather than verified through an independent process.
  • several thousand people had applied. Errors in the ages of family members were also found in some certificates.

Conclusion

The notice phase is crucial for correcting discrepancies arising from historical rolls, documentation gaps and uneven field verification. Transparent publication, accessible hearings and careful examination of claims are necessary to maintain both the accuracy and inclusiveness of Telangana’s electoral roll.

CARE MCQ

Q. With reference to Special Intensive Revision (SIR) of electoral rolls, consider the following statements:

  1. It is conducted by the Election Commission of India for large-scale revision of electoral rolls.
  2. Its legal basis includes Article 324 of the Constitution and Section 21(3) of the Representation of the People Act, 1950.
  3. It aims to include eligible voters and remove duplicate, deceased and ineligible entries.
  4. It is only a routine summary revision without house-to-house verification.

Which of the statements given above are correct?

(a) 1, 2 and 3 only
(b) 1 and 4 only
(c) 2, 3 and 4 only
(d) 1, 2, 3 and 4

Answer: (a) 1, 2 and 3 only

Explanation

  • Statement 1 is correct: SIR is a large-scale revision of electoral rolls carried out by the Election Commission of India.
  • Statement 2 is correct: It is based on the ECI’s powers under Article 324 and Section 21(3) of the RPA, 1950.
  • Statement 3 is correct: Its objective is to include all eligible citizens aged 18+ and remove duplicates, deceased persons and ineligible entries.
  • Statement 4 is incorrect: SIR is not merely a routine summary revision. It involves intensive steps such as fresh enumeration, house-to-house verification by BLOs and document verification.

FAQs

1. Does receiving a notice mean that a voter has been deleted?

No. It means that the elector must clarify a discrepancy or submit documents for verification.

2. What does ASDD mean?

It refers to electors classified as Absent, Shifted, Deceased or Duplicate.

3. How should an elector reply to a notice?

The reply and supporting documents must be submitted through the BLO.

4. What is the claims and objections period?

It runs from August 17 to September 16, 2026.

5. Until when will notice verification continue?

Verification will continue until October 15, 2026.

6. What should an omitted elector do?

An elector can approach the officials during the claims period. Those removed earlier and not issued an Enumeration Form may have to apply using Form 6.

Relevance: GS Paper III: Agriculture, groundwater, renewable energy, farm subsidies and climate change

Important Keywords for Prelims and Mains

For Prelims:

  •  PM-KUSUM, solar irrigation, grid-connected pumps, solarised agricultural feeders, feed-in tariff

For Mains:

  • Water–energy–food nexus, differentiated regional approach, groundwater monitoring, micro-irrigation, climate-resilient agriculture

Why in News?

Over the past five years, PM-KUSUM has installed more than 2.5 million solar pumps. As the government prepares PM-KUSUM 2.0, the key challenge is to expand clean and affordable irrigation without worsening groundwater over-exploitation.

Solar Irrigation and Groundwater

Heavily subsidised or free agricultural electricity has contributed to:

  • Excessive groundwater extraction
  • Falling water tables
  • Depletion of aquifers
  • Increasing subsidy burdens on electricity utilities

Solar pumps provide electricity at almost zero operating cost after installation. A standalone pump without any conservation incentive may therefore encourage farmers to pump more water.

However, solar irrigation does not automatically cause groundwater depletion. Its impact depends on:

  • Design of the irrigation model
  • Ownership structure
  • Pricing incentives
  • Local hydrogeology
  • Cropping pattern
  • Soil type
  • Economic returns from additional irrigation

The correct policy question is therefore not whether solar irrigation is inherently harmful, but which model should be deployed in a particular region and with what incentives.

Why Outcomes Depend on the Model

1. Grid-Connected Individual Solar Pumps

Farmers use solar electricity for irrigation and sell unused power to the grid. The ability to earn from surplus electricity gives them a reason to limit unnecessary pumping.

Gujarat’s Suryashakti Kisan Yojana

Under the Suryashakti Kisan Yojana, around 100 agricultural feeders were shifted to solar energy.

The programme offered a feed-in tariff of approximately ₹7 per unit. Participating farmers:

  • Recorded slower growth in energy use and irrigation than non-solar farmers
  • Earned an average of about ₹21,900 annually
  • Shifted from being only energy consumers to energy producers

The model demonstrates how pricing incentives can link energy sales with groundwater conservation.

2. Fee-for-Service Centralised Model

  • Under Bangladesh’s common centralised model, a pump owner supplies irrigation water to several farmers within a fixed command area and earns revenue from the service.
  • Solar irrigation was 20–30% cheaper than diesel irrigation, but users did not apply more water than diesel-pump users.
  • Excessive use by one farmer would reduce the operator’s ability to serve others. Financial sustainability therefore encouraged efficient and equitable distribution.

3. Standalone Off-Grid Pumps

A farmer owns or operates a pump that is not connected to the electricity grid. The electricity cannot be sold, reducing the financial incentive to conserve energy.

Its groundwater impact varies with:

  • Installed pump capacity
  • Depth of the water table
  • Whether it replaces diesel or grid electricity
  • Years of operating experience
  • Extent of irrigation already available

Comparison of Solar Irrigation Models

ModelMain FeatureGroundwater Incentive
Grid-connected individual pumpSurplus electricity sold to gridFarmer earns by reducing unnecessary pumping
Solarised agricultural feederEntire feeder shifts to solar powerBenefits DISCOMs but requires separate water-saving incentives
Fee-for-service systemOperator sells water to several farmersEfficient distribution expands the customer base
Standalone off-grid pumpIndependent irrigation without grid accessSuitable where irrigation access and groundwater risk are low

Importance of Regional Conditions

Hard-Rock and Rainfed Regions

  • Hard-rock aquifers have limited storage capacity. In rainfed areas, each additional unit of irrigation can generate high agricultural returns.
  • Evidence indicates little difference in water use between solar and non-solar farmers in such regions because irrigation remains constrained by water availability and crop needs.

Punjab and Haryana

Irrigation is already widespread and dominated by water-intensive crops such as rice and wheat. There is limited scope for further expansion of irrigated area.

The priority is to make the existing water–energy–food system more sustainable by:

  • Replacing subsidised fossil-fuel electricity
  • Rewarding reduced pumping
  • Improving irrigation efficiency
  • Lowering the financial burden on power utilities

Eastern India

Large areas remain rainfed because of expensive diesel and unreliable electricity rather than severe water scarcity.

Here, solar pumps can:

  • Expand reliable irrigation
  • Raise agricultural productivity
  • Reduce diesel dependence
  • Improve climate resilience

The immediate objective in such regions should be irrigation access, not restricting water use.

Water–Energy–Food Nexus

Solar irrigation cannot be assessed only as an energy or groundwater intervention. It affects three connected systems.

Water

Pump design and pricing influence the quantity of groundwater extracted.

Energy

Solar power can replace subsidised fossil-fuel electricity and expensive diesel.

Food

  • Reliable irrigation affects crop choice, productivity and farmers’ capacity to respond to rainfall uncertainty.
  • Policy must therefore examine combined outcomes across all three systems rather than maximise benefits in one area at the cost of another.

Environmental and Fiscal Benefits

Groundwater irrigation in India is estimated to generate 45–62 million tonnes of carbon dioxide annually.

State agricultural electricity subsidies collectively exceed ₹1 lakh crore per year.

Evidence from Gujarat indicates that each grid-connected solar farmer:

  • Offsets approximately 12.3 tonnes of CO₂ annually
  • Uses solar power on the farm
  • Exports surplus electricity
  • Helps recover public investment through reduced subsidy requirements

Subsidy savings covered nearly one-fourth of government investment within the first two years. With India having more than 25 million agricultural pumps, the potential fiscal and emission benefits are substantial.

Challenges Before PM-KUSUM 2.0

Limited Uptake of Individual Grid Connection

The model of paying farmers for surplus electricity has not expanded sufficiently because of complex connection procedures and unattractive buyback conditions.

Weak Water Incentives in Feeder Solarisation

Solarising an entire feeder supports clean-energy transition but does not automatically change farmers’ pumping behaviour.

Uniform Policy Design

Applying the same model across water-stressed, hard-rock and irrigation-deprived regions can produce unsuitable outcomes.

Inadequate Groundwater Monitoring

Without timely information on aquifer conditions, emerging stress may not be identified early.

Ownership-Centred Approach

Excessive focus on individual pump ownership can limit access for small farmers and reduce the scope for shared, efficient irrigation services.

Appropriate Model for Different Regions

Regional ConditionPreferred Approach
Water-stressed with grid accessGrid-connected pumps with surplus-power buyback
Solarised agricultural feedersAdd incentives for reduced water and energy use
Limited irrigation and poor grid accessStandalone off-grid solar pumps
Smallholder-dominated regionsShared pumps through cooperatives or associations
Low groundwater riskExpand affordable irrigation access
Emerging groundwater stressMonitoring and adaptive management

Way Forward

Improve Grid-Connected Pump Model

  • Simplify grid-connection procedures.
  • Offer attractive buyback prices.
  • Reflect the local value of water and crops in incentives.
  • Motivate DISCOMs to support farmer participation.

Link Feeder Solarisation with Water Saving

Feeder-level solarisation should be combined with:

  • Micro-irrigation support
  • Direct payments for reduced pumping
  • Incentives similar to Punjab’s Pani Bachao, Paisa Kamao
  • Crop-related measures such as Haryana’s Mera Pani Meri Virasat

Expand Shared Irrigation Services

Standalone pumps in irrigation-deprived areas should be scaled through:

  • Water-user associations
  • Water-selling entrepreneurs
  • Farmer cooperatives

This can widen access without requiring every small farmer to purchase a separate pump.

Adopt Adaptive Regional Planning

Deployment should be based on groundwater risk, aquifer type, crop pattern, energy access and the existing level of irrigation. Continuous monitoring should allow policies to be modified when stress begins to emerge.

Conclusion

Solar irrigation is not inherently responsible for groundwater over-extraction. Unsustainable outcomes arise when pump design, pricing and local water conditions are ignored. PM-KUSUM 2.0 should therefore move from uniform pump deployment to region-specific models that align farmers’ incentives with groundwater sustainability, clean energy and reliable irrigation.

UPSC PYQ

Q. With reference to solar water pumps, consider the following statements:

  1. Solar power can be used for running surface pumps and not for submersible pumps.
  2. Solar power can be used for running centrifugal pumps and not the ones with piston.

Which of the statements given above is/are correct?

(a) 1 only
(b) 2 only
(c) Both 1 and 2
(d) Neither 1 nor 2

Correct Answer: (d) Neither 1 nor 2

Explanation

Statement 1 is incorrect: Solar power can run both surface pumps and submersible pumps. Surface pumps are used for shallow water sources, while submersible pumps are used for deeper wells and borewells.

Statement 2 is incorrect: Solar power can run different types of pumps, including centrifugal pumps and piston pumps. Centrifugal pumps are common for high-flow use, while piston pumps are useful in high-head or low-flow situations.

CARE MCQ

Q. Consider the following statements regarding solar irrigation in India:

  1. Grid-connected solar irrigation can incentivise farmers to save water by allowing them to sell surplus electricity to the grid.
  2. PM-KUSUM has helped make solar pumps affordable through subsidies.
  3. Solar irrigation outcomes depend only on the source of energy and not on local hydrogeology or cropping patterns.
  4. Standalone solar pumps may be suitable in areas with poor grid access and low groundwater risk.

Which of the statements given above are correct?

(a) 1, 2 and 4 only
(b) 1 and 3 only
(c) 2, 3 and 4 only
(d) 1, 2, 3 and 4

Answer: (a) 1, 2 and 4 only

Clear Explanation

Statement 1 is correct:
In grid-connected solar irrigation, farmers can use solar power for pumping water and sell the unused electricity back to the grid. If a farmer pumps less water, more electricity remains available for sale. This creates an incentive to save water and earn income.

Statement 2 is correct:
PM-KUSUM supports solar pumps through subsidies. This has made solar irrigation more affordable for farmers, especially small and marginal farmers.

Statement 3 is incorrect:
Solar irrigation outcomes do not depend only on the source of energy. They also depend on local factors such as groundwater availability, water-table depth, soil type, cropping pattern, crop water demand and local irrigation practices. For example, solar pumps may have different effects in Punjab, Haryana and eastern India.

Statement 4 is correct:
Standalone solar pumps can be useful in areas where farmers do not have reliable electricity and where groundwater is not under serious stress. In such regions, solar pumps can improve irrigation access without immediately worsening groundwater depletion.

FAQs

1. Why can standalone solar pumps encourage over-pumping?

Their electricity has almost no operating cost, and farmers cannot earn by conserving or selling unused power.

2. How do grid-connected pumps promote water conservation?

Farmers can sell surplus electricity and therefore have a financial reason to reduce unnecessary pumping.

3. What is a feed-in tariff?

It is the price paid to farmers for electricity supplied to the grid.

4. Why is solar irrigation useful in eastern India?

It can overcome expensive diesel and unreliable electricity in areas where irrigation access remains limited.

5. What is feeder solarisation?

It involves shifting an entire agricultural electricity feeder to solar power.

6. Why are shared pumps important?

They allow small farmers to access irrigation through cooperatives, associations or water-service providers.

Relevance: Prelims: Makhana, National Makhana Board, NRCM and Central Sector Scheme

Important Keywords for Prelims and Mains

For Prelims:

  • Euryale ferox, aquatic crop, National Makhana Board, NRCM, HSN Code

For Mains:

  •  Value-chain development, premiumisation, processing, export diversification, farmer collectivisation

Why in News?

India’s makhana sector is expanding due to rising demand for healthy, plant-based foods. The government has established the National Makhana Board and approved a ₹476.03-crore Central Sector Scheme for the Development of Makhana for 2025–26 to 2030–31.

About Makhana

  • Makhana, scientifically known as Euryale ferox, is an aquatic crop cultivated mainly in shallow ponds, lakes and wetlands.
  • Its edible part is the seed. After roasting and popping, it is consumed as fox nut.

India is the world’s largest producer, supported by:

  • Suitable agro-climatic conditions
  • Traditional cultivation knowledge
  • Expanding domestic demand
  • Growth of branded products
  • Participation of startups and FPOs

Makhana has evolved from a traditional food of Bihar into a nationally consumed health snack and internationally marketed superfood.

Production and Geographical Distribution

Makhana cultivation is concentrated mainly in:

  • Bihar
  • West Bengal
  • Assam

Bihar’s Dominant Position

Bihar accounts for nearly three-fourths of India’s production and supplies around 80–85% of global makhana.

Major cultivation areas include:

  • Kosi basin: Supaul, Saharsa and Madhepura
  • Mithila region
  • Seemanchal region

Domestic Market

India produces more than 0.6 lakh MT of makhana annually. Around 40% is estimated to be exported, while the remaining quantity is consumed domestically.

The domestic market grew by 17–18% annually between 2021–22 and 2024–25, driven by:

  • Health awareness
  • Premium branding
  • Entry of organised companies
  • Expansion of retail networks
  • Demand for packaged snacks

The market is projected to reach ₹11,000–12,000 crore by 2029–30.

Price and Supply Trends

Production volumes increased by only 4–5% between FY2022 and FY2025, while average prices rose from:

  • Around ₹500 per kg during 2020–22
  • To nearly ₹1,250 per kg in 2025

The rise reflected strong demand, premiumisation and a limited supply response.

Export Performance

  • Before 2025, makhana was included under general Harmonised System of Nomenclature codes, making product-specific export data unavailable.
  • In 2025, the Directorate General of Foreign Trade introduced separate HSN codes for popped makhana and other makhana products.

During 2025–26, India exported:

  • 7,264.89 MT of makhana products
  • Products worth ₹192.96 crore

Major Export Markets

CountryExport ShareAverage Unit Price
United States40%$19.5/kg
Canada20%$15.8/kg
UAE17%$13.3/kg
United Kingdom10%$20/kg
GermanyLimited share$26/kg
NepalLimited share$21.6/kg
AustraliaLimited share$21/kg

The US, Canada and UAE together account for 77% of exports. However, Germany, Nepal and Australia offer higher unit prices despite receiving smaller volumes.

This creates scope to diversify towards premium-paying markets while retaining high-volume destinations.

National Makhana Board

The establishment of the National Makhana Board was announced in the Union Budget 2025–26. It was formally launched in Bihar on September 15, 2025.

The Board seeks to strengthen and modernise the complete makhana value chain through support for:

  • Cultivation
  • Processing
  • Farmer organisation
  • Value addition
  • Branding
  • Marketing
  • Quality control
  • Exports

The initiative recognises makhana as an important crop for farmer incomes, rural industries and agricultural trade.

Central Sector Scheme for Development of Makhana

The scheme has a total allocation of ₹476.03 crore for 2025–26 to 2030–31.

Annual Allocations

  • 2025–26: ₹30 crore
  • 2026–27: ₹90 crore

Major Objectives

  • Promote research and innovation
  • Improve quality-seed availability
  • Strengthen farmers’ skills
  • Modernise harvesting practices
  • Upgrade post-harvest operations
  • Encourage value addition
  • Improve branding and marketing
  • Expand exports
  • Strengthen quality-control systems

Makhana Value Chain

1. Farm-Level Production

Activities include:

  • Pond preparation
  • Seed broadcasting
  • Crop management
  • Underwater seed collection
  • Manual harvesting

This stage remains labour-intensive, skill-dependent and only partially mechanised.

2. Primary Processing

Mostly undertaken at the household or village level, it involves:

  • Cleaning and drying
  • High-temperature roasting
  • Popping
  • Polishing
  • Sorting
  • Grading

Larger and better-quality popped makhana receives higher market prices.

3. Secondary Processing

Value-added products include:

  • Flavoured makhana
  • Ready-to-eat snacks
  • Makhana flour
  • Packaged products

This segment offers considerable potential for enterprise creation and employment.

National Research Centre for Makhana

The National Research Centre for Makhana supports research, technology development and capacity building.

Major Contributions

  • Developed high-yielding makhana varieties
  • Developed thornless water chestnut varieties
  • Introduced water-efficient farming systems
  • Promoted integrated cultivation
  • Developed makhana-cum-fish farming
  • Distributed 15,824.1 kg of high-yielding seed
  • Trained more than 3,000 farmers between 2012 and 2023
  • Provided technical support to 24 enterprises

Training has covered:

  • Efficient water use
  • Cropping systems
  • Nutrient management
  • Processing
  • Marketing

Mechanisation Support

NRCM has developed and licensed:

  • Seed washer
  • Seed grader
  • Primary roasting machine
  • Popping machine
  • Popped-makhana grader
  • Technologies for value-added products

A proposed train-the-trainers approach with agricultural universities seeks to improve extension support across cultivation, grading, processing, packaging and branding.

Significance

Farmer Income

Higher demand, improved varieties and premium markets can raise returns from makhana cultivation.

Rural Employment

Harvesting, popping, grading, packaging and product development generate labour and enterprise opportunities.

Food Processing

Flavoured snacks, flour and ready-to-eat products expand the value captured within producing regions.

Export Potential

India’s global production leadership provides a strong foundation for developing a premium superfood export category.

Wetland-Based Livelihoods

Makhana cultivation supports communities using ponds, lakes and other shallow water bodies.

FPO and Startup Growth

Farmer organisations and new enterprises can improve aggregation, branding and market access.

Major Challenges

  • Labour-intensive underwater harvesting
  • Limited mechanisation
  • Traditional household-level processing
  • Slow growth in production relative to demand
  • Sharp increase in prices
  • Concentration of exports in three markets
  • Uneven quality and grading
  • Limited penetration of branded products in smaller markets
  • Need for better seed supply and post-harvest technology

Way Forward

  • Expand improved varieties and quality-seed production.
  • Promote field-system and water-efficient cultivation.
  • Scale mechanised harvesting, roasting, popping and grading.
  • Strengthen FPOs for aggregation and collective marketing.
  • Develop common processing and packaging facilities.
  • Improve quality-control and product standardisation.
  • Support startups producing diversified makhana products.
  • Target premium-paying export destinations.
  • Expand extension services through the train-the-trainers model.
  • Link research, production, processing and branding through the National Makhana Board.

Conclusion

India’s makhana sector is moving from traditional wetland cultivation towards an organised food-processing and export industry. Research, mechanisation, farmer collectivisation and premium-market development can help convert India’s production leadership into higher rural incomes and stronger global competitiveness.

CARE MCQ

Q. With reference to Makhana, consider the following statements:

  1. Makhana is scientifically known as Euryale ferox.
  2. The edible part of the makhana plant is its seed.
  3. In India, it is mainly cultivated in Bihar, West Bengal and Assam.

Which of the statements given above are correct?

(a) 1 and 2 only
(b) 2 and 3 only
(c) 1 and 3 only
(d) 1, 2 and 3

Answer: (d) 1, 2 and 3

Explanation

  • Statement 1 is correct: Makhana is scientifically known as Euryale ferox.
  • Statement 2 is correct: The edible part of the plant is its seed, which is roasted or processed and consumed as fox nut.
  • Statement 3 is correct: In India, makhana cultivation is mainly concentrated in Bihar, West Bengal and Assam, supported by suitable wetlands, ponds and shallow water bodies.

FAQs

1. What is the scientific name of makhana?

Its scientific name is Euryale ferox.

2. Which State leads makhana production?

Bihar is India’s leading producer and the centre of global makhana supply.

3. When was the National Makhana Board launched?

It was launched in Bihar on September 15, 2025.

4. What is the scheme’s total allocation?

The Central Sector Scheme has an outlay of ₹476.03 crore for 2025–26 to 2030–31.

5. Why was a separate HSN code introduced?

It enables product-specific tracking of makhana exports.

6. What are the main value-added products?

They include flavoured snacks, ready-to-eat makhana, flour and packaged products.

TGPSC Current Affairs August 21st 2026
TGPSC Current Affairs August 19th 2026

Enroll Now for Unlimited UPSC Utsav

Start Date

22/03/2026

Timings

08 AM – 4 PM

    Courses

    Scroll to Top