Demography is the statistical study of human populations, focusing on their size, composition, and distribution across space, as well as the processes that cause populations to change over time. Understanding demographic patterns is crucial for governments, as it provides valuable insights needed to develop effective programs and policies. By analyzing these patterns, governments can design strategic and targeted interventions that address the specific challenges faced by vulnerable social groups within the state. This information is essential for ensuring that policies are inclusive and meet the needs of all segments of the population
Total Population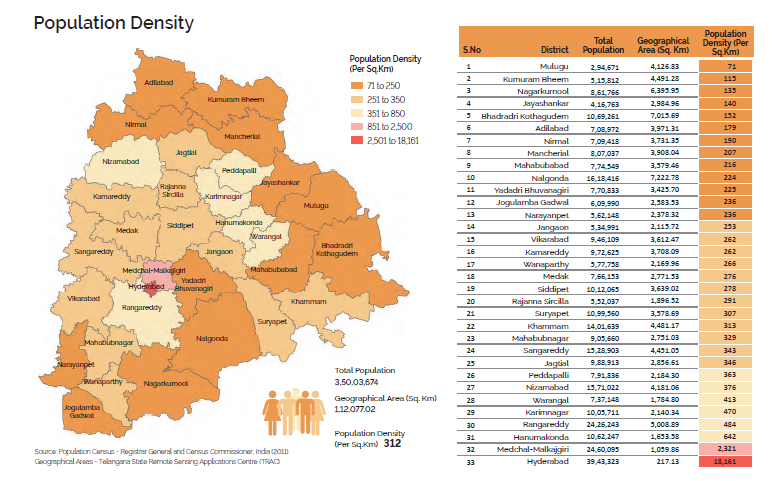
2011 Census: Telangana had a population of 35 million, constituting 2.89% of India’s total population.
Projections:
- 2021:7 million (2.77% of India’s population).
- 2031:2 million (2.66% of India’s population).
Trend: Telangana’s share in the national population is projected to decrease by 0.23 percentage points from 2011 to 2031.
Gender-wise Population
2011 Data:
- Females: 17.4 million (49.7% of total population).
- Males:6 million (50.3% of total population).
Sex Ratio: 988 females per 1000 males.
- Lowest Sex Ratio: Rangareddy (950).
- Highest Sex Ratio: Nirmal (1046).
Median Sex Ratio: 996 (Suryapet, Mahabubabad, Hanumakonda).
Urban and Rural Population
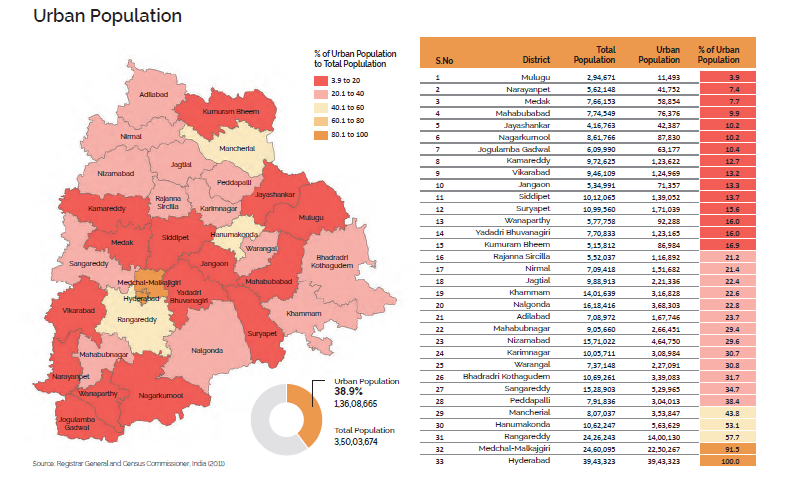
- Urban Population: 13.6 million (38.9% of total population).
- Rural Population: 21.4 million (61.1% of total population).
Most Urbanized Districts:
- Hyderabad: 100% urban.
- Medchal Malkajgiri: 91.5% urban.
Most Rural Districts:
- Mulugu: 96.1% rural.

- Narayanpet: 92.6% rural.
Social Groups
- Scheduled Castes (SCs): 5.4 million (15.5% of total population).
- Scheduled Tribes (STs): 3.2 million (9.1% of total population).
District-wise Distribution:
- Highest SC Population: Mancherial (24.7%).
- Lowest SC Population: Hyderabad (6.3%) and Medchal-Malkajgiri (9.4%).
Literacy
Total Literate Population: 20.7 million (66.5% literacy rate).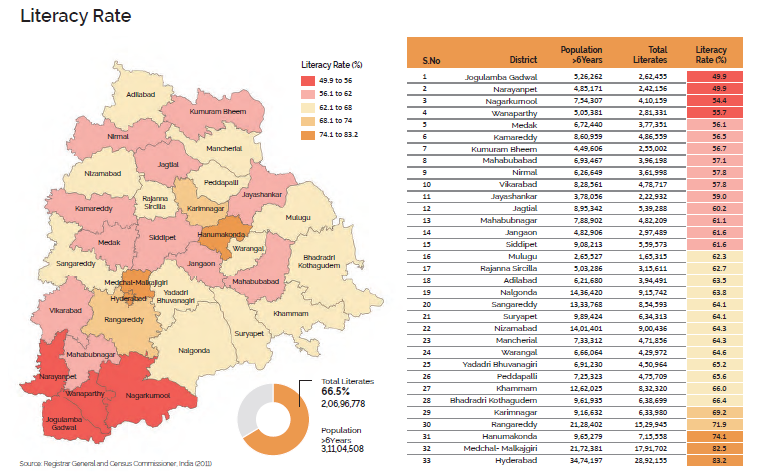
- Females:0% literacy.
- Males: 75.0% literacy.
Urban vs Rural Literacy:
- Urban:1% literacy.
- Rural:3% literacy.
Child Sex Ratio (0-6 years)
- Total Children:9 million (1.88 million females and 2.02 million males).

- Child Sex Ratio: 932 females per 1000 males.
- Lowest CSR: Wanaparthy and Mahbubabad (903).
- Highest CSR: Mulugu (971).
Q. Discuss the demographic characteristics of Telangana.
| Introduction | Demography is the statistical study of human populations it provides insights into the size, composition, and distribution of populations and the processes through which they change. Telangana has a diverse demographic profile that reflects its socio-economic, cultural, and geographic characteristics. Understanding these demographic characteristics is essential for policy formulation and the development of targeted interventions to address the needs of various population groups in the state. |
| Body | 1. Population Size and Growth:
· As of the 2011 Census, Telangana’s population was 3,50,03,674, constituting approximately 2.89% of India’s total population. · Projections by the National Commission on Population estimate that the population will grow to 3,77,25,000 by 2021 and 3,92,07,000 by 2031. Despite this growth, Telangana’s share of the national population is expected to decline slightly from 2.89% in 2011 to 2.66% in 2031, indicating a slower population growth relative to the national average. 2. Gender Composition · Telangana had a slightly higher male population in 2011, with 1,76,11,633 males (50.3%) and 1,73,92,041 females (49.7%). 2. Sex Ratio: · The overall sex ratio of the state stood at 988 females per 1,000 males. However, there were significant variations across districts, with Nirmal having the highest sex ratio at 1046, and Rangareddy the lowest at 950. 3. Urban and Rural Distribution: · The population is predominantly rural, with 61.1% residing in rural areas and 38.9% in urban areas. · Hyderabad and Medchal Malkajgiri are the most urbanized districts, while districts like Mulugu and Narayanpet have the highest rural populations, at 96.1% and 92.6% respectively. 4. Social Groups: · The Scheduled Castes (SC) and Scheduled Tribes (ST) form significant portions of the population, with SCs constituting 15.5% and STs 9.1%. · Mancherial district has the highest SC population share at 24.7%, while Hyderabad has the lowest at 6.3%. ST populations are concentrated in tribal areas, reflecting the state’s cultural diversity. 5. Literacy Rates: · The overall literacy rate in Telangana is 66.5%, with a noticeable gender gap—75.0% for males and 58.0% for females. · Urban areas have a significantly higher literacy rate (81.1%) compared to rural areas (57.3%), highlighting the disparity in educational access between urban and rural populations. 6. Child Sex Ratio: · The child sex ratio (CSR) in the state is 932 females per 1,000 males, reflecting concerns over gender disparity at birth. · The CSR varies across districts, with the lowest in Wanaparthy and Mahbubabad (903) and the highest in Mulugu (971), indicating varying socio-cultural practices across the state. |
| Conclusion | Telangana’s demographic profile is characterized by a blend of rural and urban populations, significant social diversity, and noticeable disparities in gender composition and literacy rates. These characteristics underscore the need for targeted and inclusive development policies. Understanding these demographic trends is crucial for the government to address the challenges faced by various social groups and to promote balanced socio-economic growth across the state. By focusing on improving gender balance, enhancing educational access, and addressing rural-urban disparities, Telangana can work towards a more equitable and prosperous future. |